2023 Point-in-Time Count
2023 Point-in-Time Count: Background and Methodology
The annual Point-in-Time (PIT) Count is a federally mandated submission to the U.S. Dept. of Housing and Urban Development. The PIT Count provides a count for a single night in January of persons experiencing homelessness in Marion County. This includes individuals who are unsheltered (i.e., living somewhere not meant for habitation), staying in a shelter, or in a hotel/motel funding with emergency funds. Data for folks in shelters is either pulled directly from the Homeless Management Information System (HMIS) or provided from shelters (e.g., domestic violence shelters).
The 2023 PIT Count continued previous methodologies of surveying unsheltered individuals across multiple days. Individuals were all asked about the night of January 23, 2023. In addition to locations where individuals were known to be staying, the 2023 survey relied on over 100 volunteers to administer surveys at multiple service-based sites (e.g., libraries, local churches, meal sites) to expand the reach of the Count. The 2023 unsheltered survey was administered electronically to eliminate paper surveys.
The PIT Dashboard with data going back several years is below, but if you would like to read a full narrative and methodology for the 2023 Point in Time Count, you may do so here:
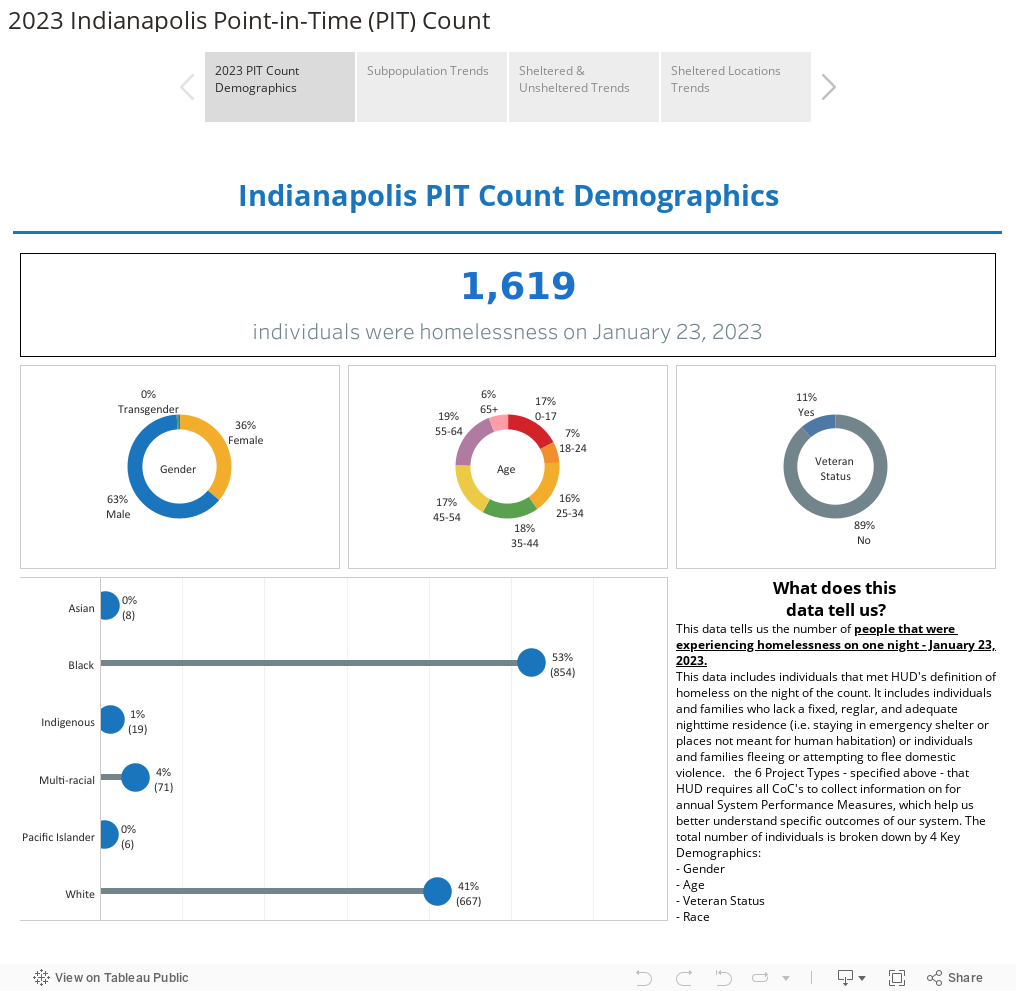
Key Takeaways:
- 1,619 individuals were counted in the 2023 PIT Count, an 8% decrease from 2022.
- The number of sheltered individuals decreased 19% in 2023. However, the number of unsheltered individuals increased 77% overall and 133% for Black individuals.
- Black individuals continued to be disproportionately represented in the 2023 Count, accounting for 52% of the total Count, 60% of individuals in shelters, and 71% of individuals in families.
- There was a 17% decrease in individuals in families staying in emergency shelters or transitional housing; however, 2023 had the largest number of unsheltered families to date.
- There was a 130% increase in people experiencing chronic homelessness
- The number of unaccompanied youth (age 18-24) experiencing homelessness decreased 54%.
- The number of parenting youth decreased 57%
- The number of veterans experiencing homelessness increased 9%.
For questions about this dashboard, please email Danielle Bagg Wireman.
Update frequency: Every July after the PIT Count is completed and analyzed
Data Source: The Point In Time Count
How to use the dashboard:
This dashboard contains a lot of information, but you hover your mouse over the data points to see information pop-ups and learn more. You can also view the dashboard using different filters that will impact what information is highlighted in the dashboard’s presentation.